

One of convenient, nifty features of many traditional index-based small-cap equity funds is that these products often provide access to hundreds or, in some cases, thousands of stock under a single umbrella – a beneficial trait in a corner of the equity market that often lacks analyst coverage.
Additionally, small-cap index strategies, be they index funds or exchange traded funds, are popular with advisors and clients because the size premium has often worked in favor of risk-tolerant market participants and because stock-picking in this space is notoriously difficult.
Those benefits should not be glossed over. If anything, they’re to be embraced, but that doesn’t alter the fact that not all small-cap indexes are created equal – an especially important point for advisors and investors willing to wager that smaller stocks could soon be nearing a new era of out-performance. Consider the comparison of the Russell 2000 and the S&P SmallCap 600 indexes.
Those benchmarks and various offshoots are the underlying gauges for more than a quarter of the 25 largest small-cap ETFs as measured by assets and that doesn’t take into account index funds following those gauges or actively managed funds attempting to beat those benchmarks. Popularity and recognition may link the Russell 2000 and the S&P SmallCap 600, but they are very different collections of small stocks – something advisors and investors need to be aware of.
Details Matter
Among the key differences between the two major small-cap indexes is, no pun intended, size. ETFs tracking the Russell 2000 hold about 1,980 stocks while their S&P SmallCap 600 rivals hold roughly 630 stocks.
The Russell 2000’s larger roster size may sound like a benefit, but it comes with risks. For example, as of the end of the third quarter of 2024, 42% of that index’s components were money-losing firms, according to Capital Group. Sure, there are times when “junk” stocks outperform, but it’s hard for unprofitable small-caps to accomplish that feat for extended periods of time when interest rates are elevated, as is the case today. But even during eras of low rates, the S&P index topped its rival.
“A key driver of this outperformance has been the S&P 600’s statistically significant exposure to the quality factor, which explains about 74. 7% of its historical outperformance,” notes S&P Dow Jones Indices. “Unlike the Russell 2000, the S&P 600 applies an earnings screen that requires consistent profitability for new constituents—a feature historically linked to outperformance in small caps. ”
In plain English, there’s a profitability requirement for admittance into the S&P SmallCap 600, one not found with some other popular small-cap barometers, and it’s made a material difference over the long-term, as highlighted by the S&P chart below.
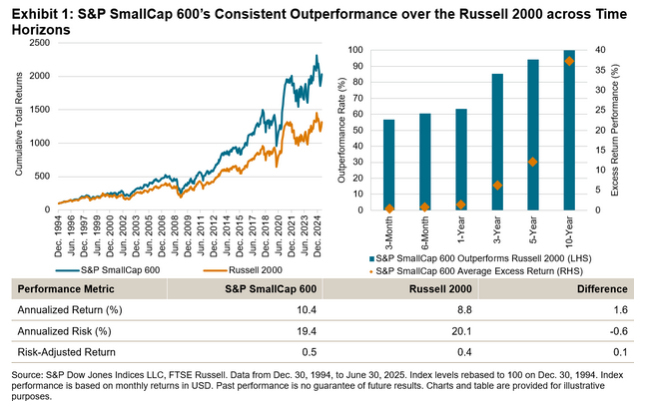
With Small-Caps, Quality Helps
The quality factor is often debated, even misunderstood, but in its most basic form, it’s an all-weather strategy that can enhance long-term returns via attributes including earnings quality, low leverage and return on equity (ROE) – hallmarks found with the S&P SmallCap 600.
“The S&P 600’s consistent historical outperformance over the Russell 2000 has stemmed from its earnings-based quality tilt,” concludes S&P Dow Jones. “By requiring a profitability screening, the index tracks small-cap companies with strong and stable fundamentals. This underscores the importance of index design and why index construction matters—quality, in this case, is built by design. ”